
Based on environmental observations collected in a Cambridge attic, will it rain in the next two hours? How much?
Introduction
The challenge of predicting the weather has plagued humanity since time immemorial. Rain can make or break a once-in-a-lifetime event like a wedding, and it can also impact the day-to-day life of commuters, farmers, and students like us. Using the sensor data we gathered, we wanted to see if we could contribute a new solution to this age-old problem.
Steps
01. Data cleaning
Before we could begin our analysis, we needed to clean and stitch together the data from the sensors and from the public rainfall dataset. We had to compensate for different sample rates. For example, light was measured every 5 minutes, whereas pressure every 30. We also changed some metrics to sample every 15 minutes later on in the month.
We normalized sample frequency across all the different data types by coordinating timestamps.
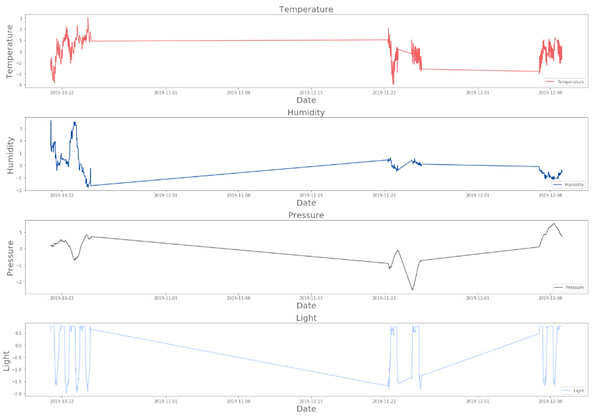
02. Basic visualizations

Once we had our data nicely in dataframes, we could see exactly what we were dealing with. First, we performed some basic visualizations of each variable. These graphs show each of our five sensors' data plotted by index - in other words, these graphs don't compensate for the time skips between successful data samples. We can also see a numerical summary of the data from each sensor.
As you can see from the graph, we didn't get any good data from the motion sensor. It's possible that it wasn't positioned correctly, or that it was broken in some way. Regardless, we won't be able to get anything interesting from that sensor measurement for our models.
Besides motion, the other graphs all look normal. The periodicity of the light measurement is to be expected (it likely reflects day vs. night). Same with temperature. We'll come back later to explore pressure and humidity in more detail.
A note on time jumps
It's important to remember that the visuals above don't reflect the discontinuity of our data measurements. Our successful samples weren't continuous, so there are large gaps where we don't have any data. Below, you can see what our data looks like with those time jumps incorporated. It's much harder to see relevant patterns in the data this way, so for the rest of our analysis we proceeded with the version without the time jumps.
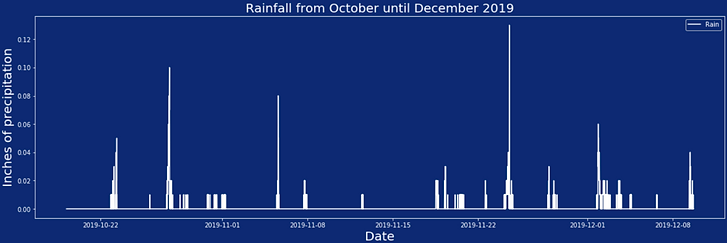
03. Incorporating rain data
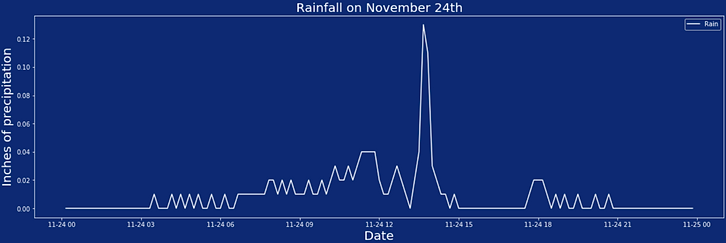
Given the paucity of data we took from the sensors, we decided to augment with a publicly available dataset on Boston rainfall. The full dataset can be found here. We started the same way we did the sensor data: with some basic visualizations of the data to see what we can see. Below is a graph of the rain data during all of our sensor measurements, along with a small sample of what one day's worth of rain looks like.
Combining with Sensor Data
Once we had a sense of what the rain data looked like, we needed to smush it into our sensor data.
The rain data is sampled every 10 minutes, so we matched timestamps with the sensor data first. To do that, one option was to take the closest point in the rain dataset to the timestamp we're trying to match to. However, the rain data is very "spiky," which might have led to some distortion. A better idea is to average over the two closest points.
Once we did the timestamp-matching, we added it to our sensor dataframe. Below, you can see a full visualization of all of our data measurements.

04. Can we tell if it's raining using sensor data?
One of the big worries we had coming into this project was that rain wouldn't be common enough to be able to give us the amount of training data we would need. From the graph above, we can see that while rain is not that common, this data is at least somewhat workable.
Initial results
We began with a standard Logistic Regression model and a 75-25 train-test split. We stratified based on whether rain was occurring. This model did incredibly well for a first pass: the train accuracy was 0.93, and the test accuracy was even better at 0.95. The F1 scores for train and test, respectively, were 0.06 and 0.4.
Problem: Not enough rain
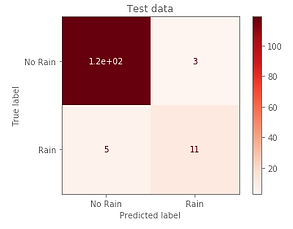
As we predicted, the biggest problem with the data is that rain is rare compared to no rain. Below, you can see the confusion matrices for the train and test sets of rain occurrences. While there are 395 and 131 occurrences of no rain in train and test respectively, there are only 23 and 7 for rain.
We needed to pivot to a question that would place less stringent requirements on the data. Rather than predict whether it's raining right now, can we instead predict whether it will rain within the next 2-hour window? This gives us much more flexibility in the data, while also having the upside of answering a more useful question. Hardly anyone needs a data model to tell them if it's raining outside; they can just look out the window. But forecasting rain is a much more useful capability.
Given the above, it makes sense to take a practical question that would actually be useful if all weather apps covering the Boston area simultaneously failed for some reason: "Should I bring an umbrella?" That is: "Will it rain in the next 2 hours?"


05. Can we predict if it will rain using the sensor data?
We created a column in our dataframe that reflects whether rain occurs in the next two-hour time window. Then we ran a new Logistic Regression with the same train-test split and stratification as our last model. Below, you can see the new confusion matrices of the train and test datasets, showing that there are a lot more rain values to work with now. The analysis so far suggested that while it's very difficult to pinpoint rain at the precise moment of observation, it is much more feasible if we take a range that both smooths moment-to-moment variability and helps to address the lopsided class distribution.
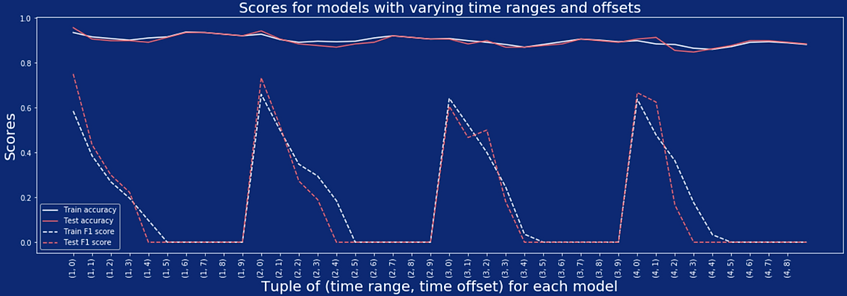
Once we saw that the forecasting window worked better, we experimented with the size of the forecasting window. We played around with both window size and future offset (i.e. how far in the future we're attempting to forecast). You can see the plot showing how our accuracy and F1 scores varied with the time range and offset. The models all tended to have the same train and test accuracy with different windows and offsets, but the F1 scores varied dramatically.
Results
We found the best combination of range and offset to be a two hour window with zero time offset. In other words, we can forecast the weather the best two hours in advance of the current moment. For that model, our accuracy scores for train and test respectively were 0.93 and 0.94. Our F1 scores for train and test were 0.66 and 0.73.

Expanding the time window produces more occurrences of rain to consider.
Improving the model
We already had a very strong model, but we wanted to see if we could improve it further. To do so, we tried cross-validation and regularization. We didn't see much improvement, only achieving train/test accuracy of .93 and .94, with F1 train/test scores of .67 and .77. This was no improvement over our previous accuracy, and only a slight improvement in F1 scores.
Predicting amount of rain
We've shown that we can predict with very good accuracy whether it will rain or not in the next two hours, using only sensor data from the attic. But in addition to knowing whether it will rain, people often want to know how much it will rain. We decided to address this question. Given our sensor data, can we predict how much rain we'll get in the next 2 hours?
We began with a very basic Linear Regression. We created the dataframe using the same optimal time range and offset from the Logistic Regression model. We created a 75-25 train-test split, and trained the model with no bells or whistles. We got an of .30 for the train dataset and .24 for the test dataset.
